Making Numbers More Digestible
Annual Report Infographics for Algonquin College's 2016 Annual Report
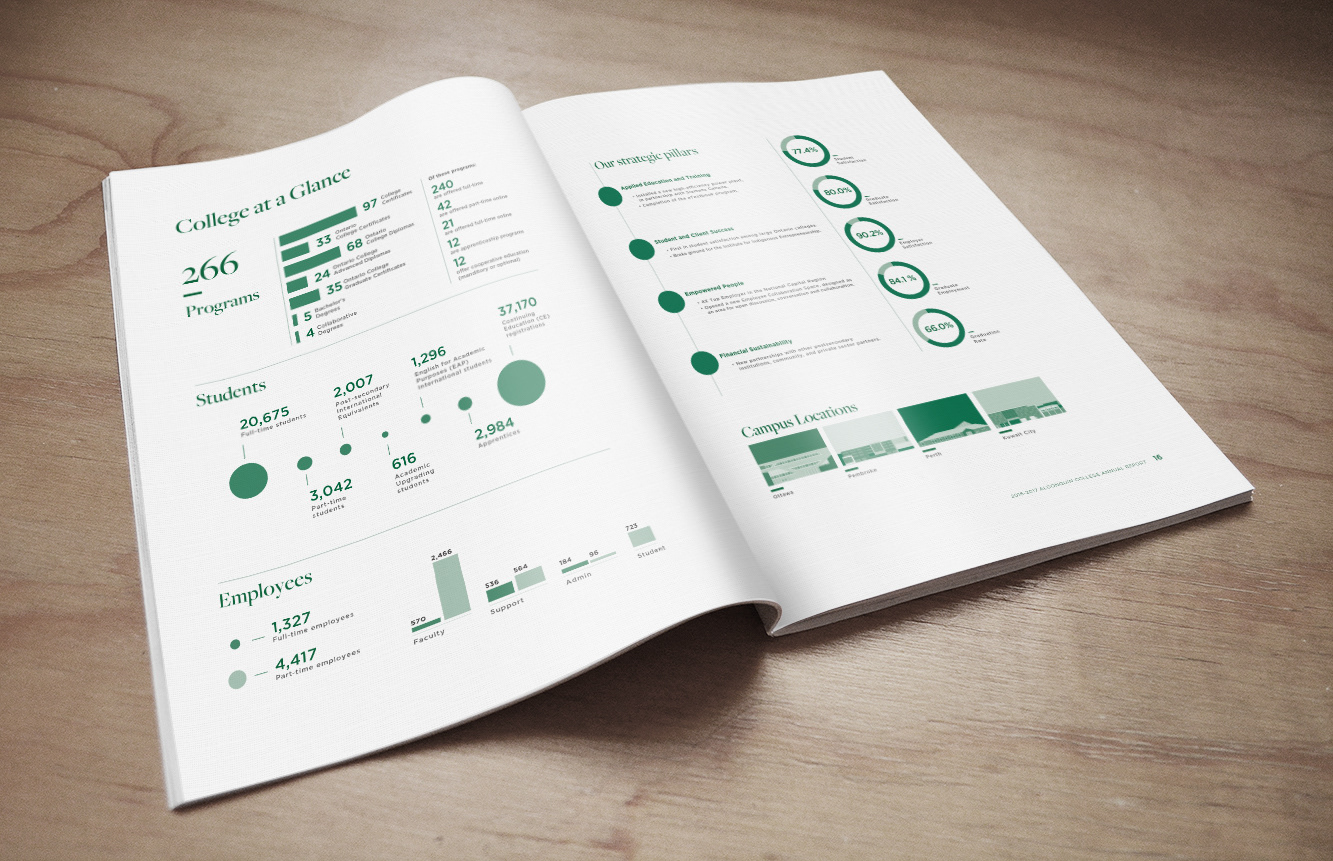
The many-page annual report contains a lot of written and visual information, and this infographic spread breaks down the College into a collection of interesting stats and milestones. It makes use of the College's new brand standards, and new illustration style. The first three building illustrations were not completed by me (by Salt in Ottawa), and I completed the last illustration.
The Kuwait building illustration I created for this project has gone on to become part of a wall mural I also designed for use in Algonquin's overseas campus in Kuwait.
The Kuwait building illustration I created for this project has gone on to become part of a wall mural I also designed for use in Algonquin's overseas campus in Kuwait.
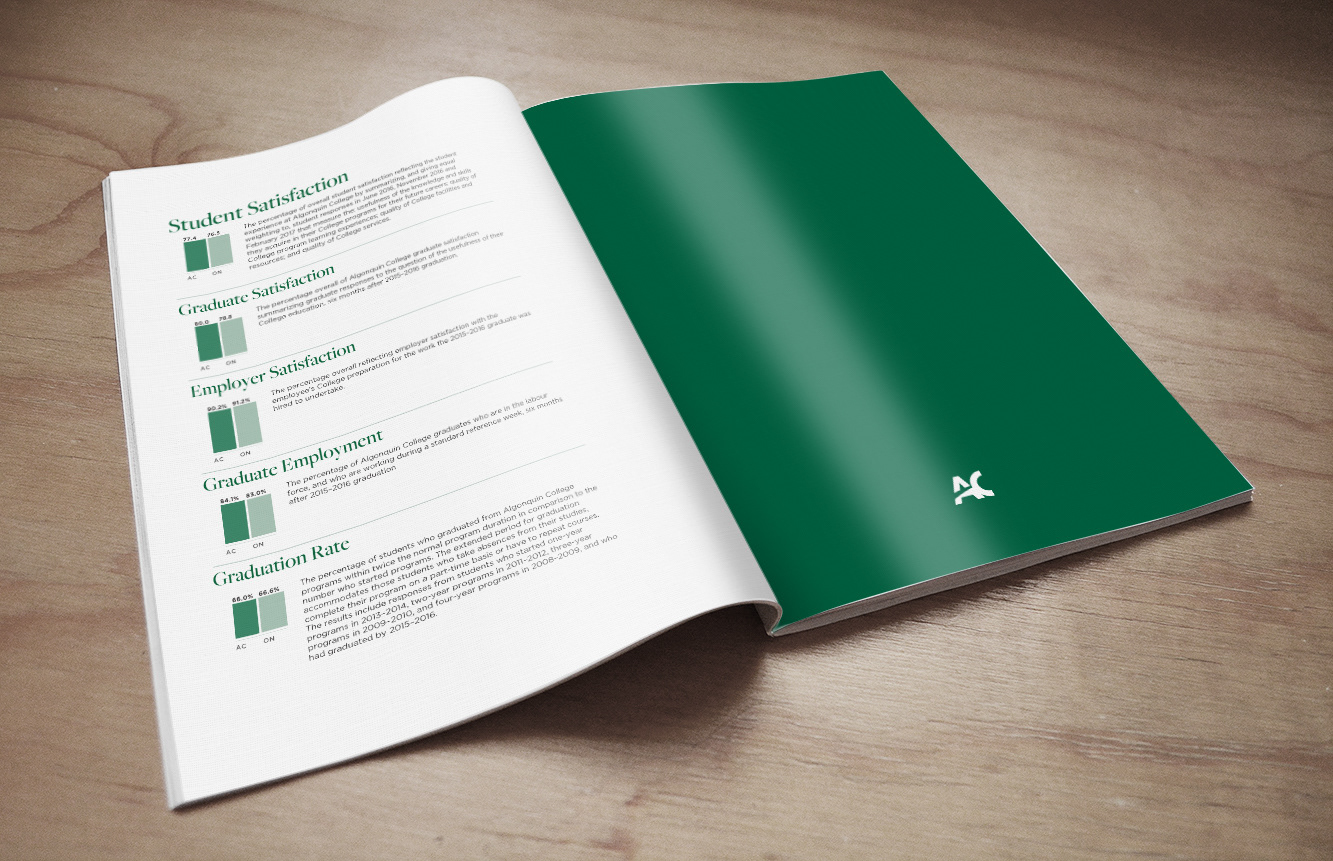
The second last page of the document compares Algonquin to provincial KPI rankings and includes interpretations. It utilizes the same style from the earlier spread.

The Kuwait environmental graphic for one of two murals in a waiting area in Algonquin's overseas campus. Appx size 2'x4'